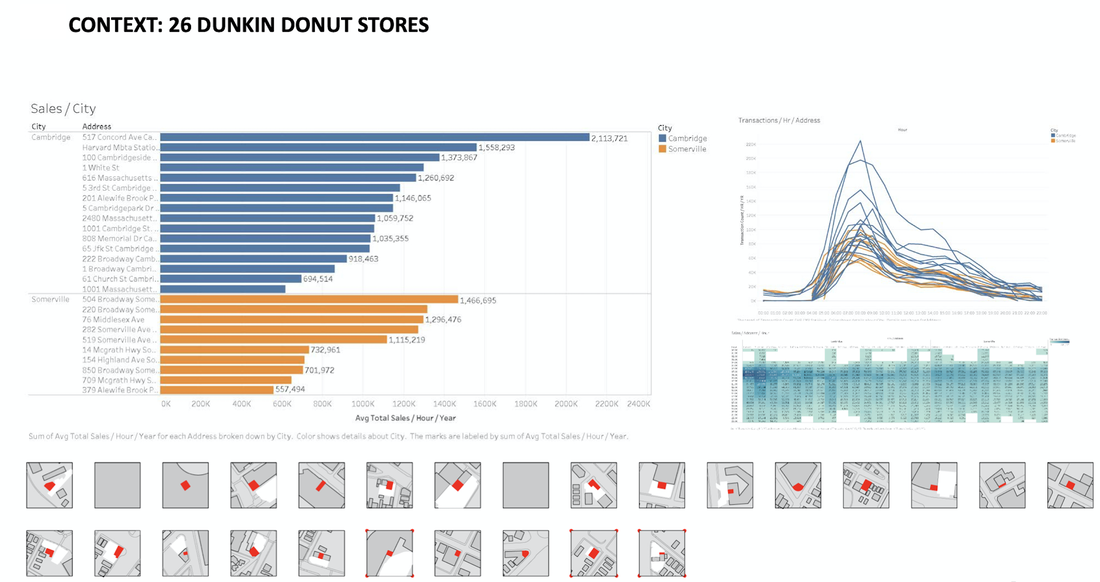
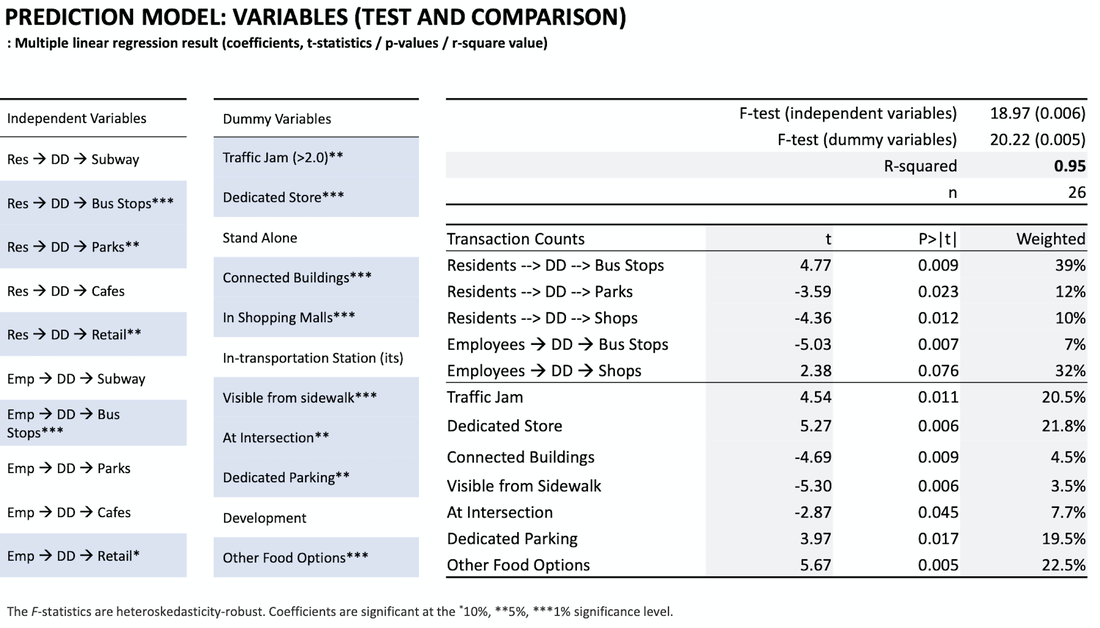
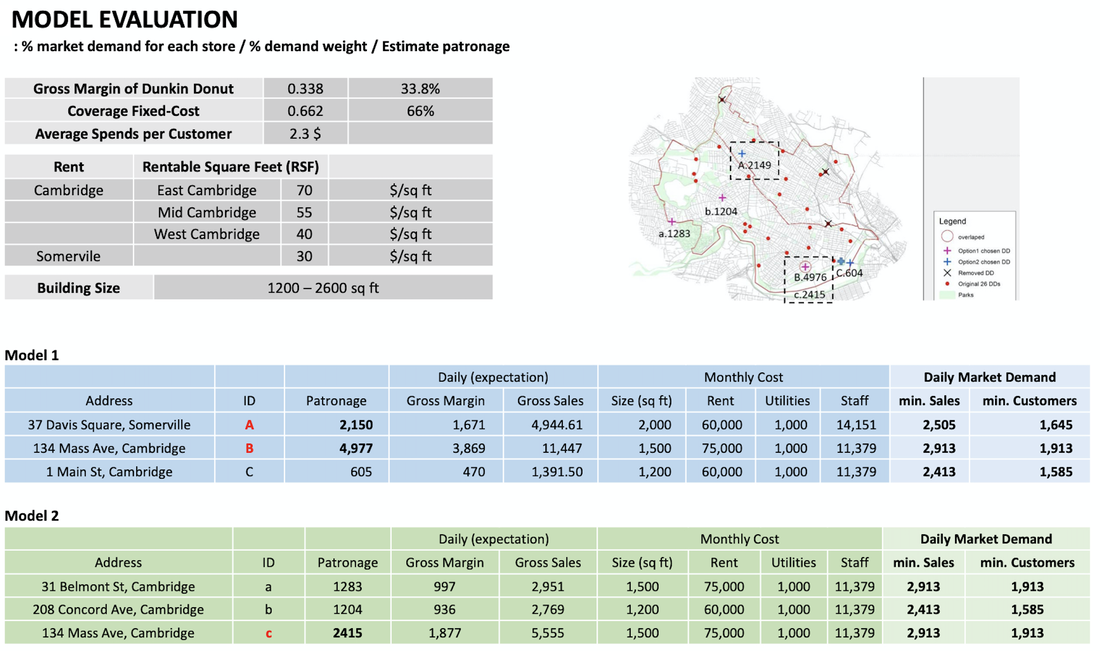
Business location and patronage
Project Goal: Patronage analysis to the existing Dunkin Donuts stores
Site: Cambridge Market Area
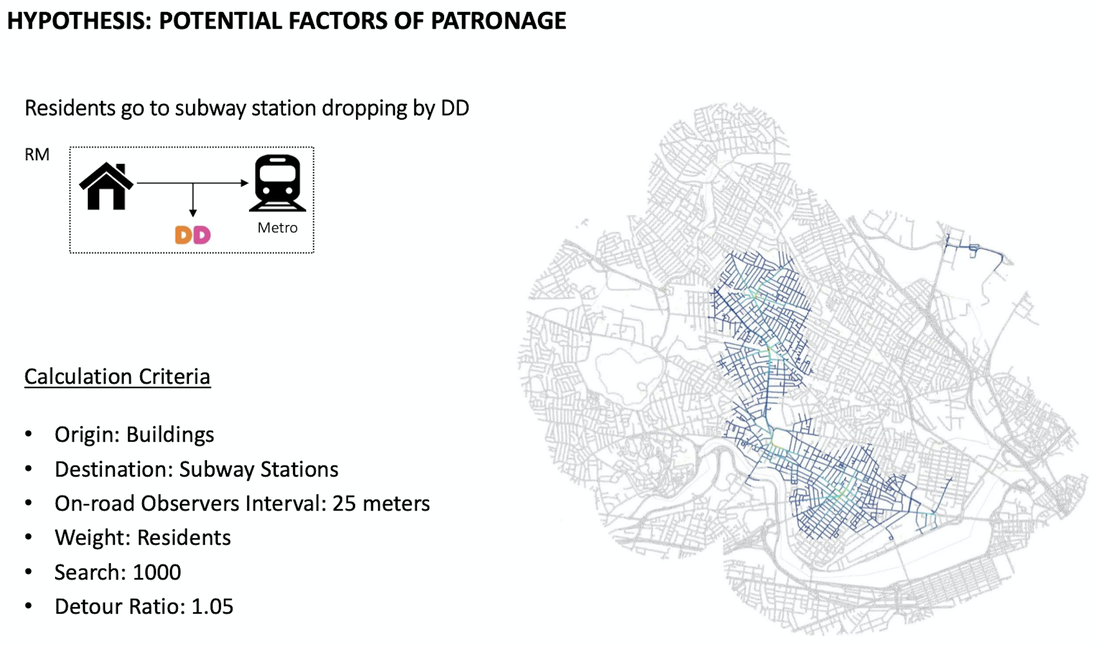
Method: Patronage analysis
Tool: Arc GIS, Urban Network Analysis (UNA) toolbox in Rhino, Excel
Date: 2017, GSD Advanced spatial analysis
Site: Cambridge Market Area
Method: Patronage analysis
Tool: Arc GIS, Urban Network Analysis (UNA) toolbox in Rhino, Excel
Date: 2017, GSD Advanced spatial analysis
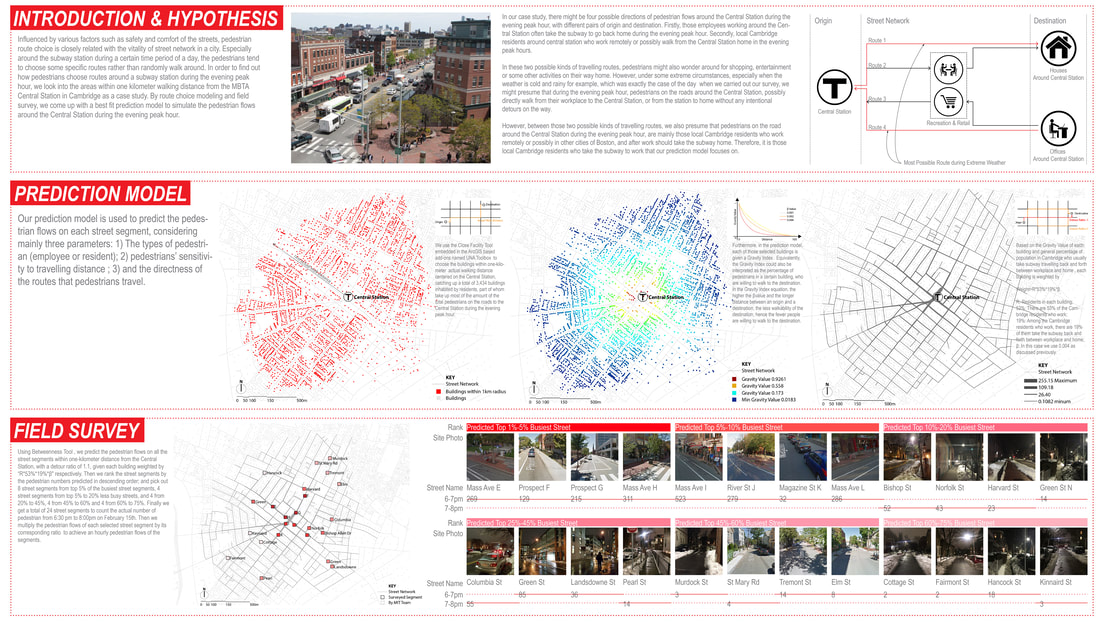
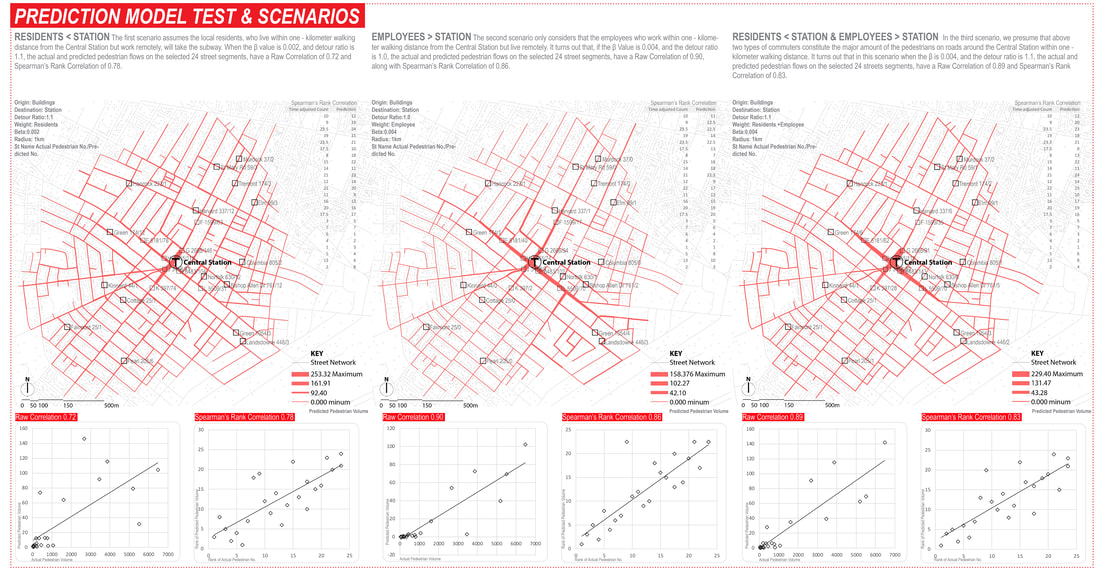
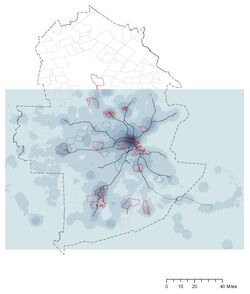
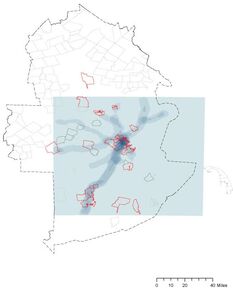
How do pedestrian choose routes?
Research Goal: Predict the pedestrian route choice pattern during the evening peak hours
Site: Central Station, Cambridge MA
Method: Accessibility analysis for pedestrians (Betweenness), Rank Correlation
Tool: Urban Network Analysis (UNA) toolbox in Rhino
Date : 2017, Harvard ESRI Development Center Student of the Year Award
Site: Central Station, Cambridge MA
Method: Accessibility analysis for pedestrians (Betweenness), Rank Correlation
Tool: Urban Network Analysis (UNA) toolbox in Rhino
Date : 2017, Harvard ESRI Development Center Student of the Year Award
Design for mobility route
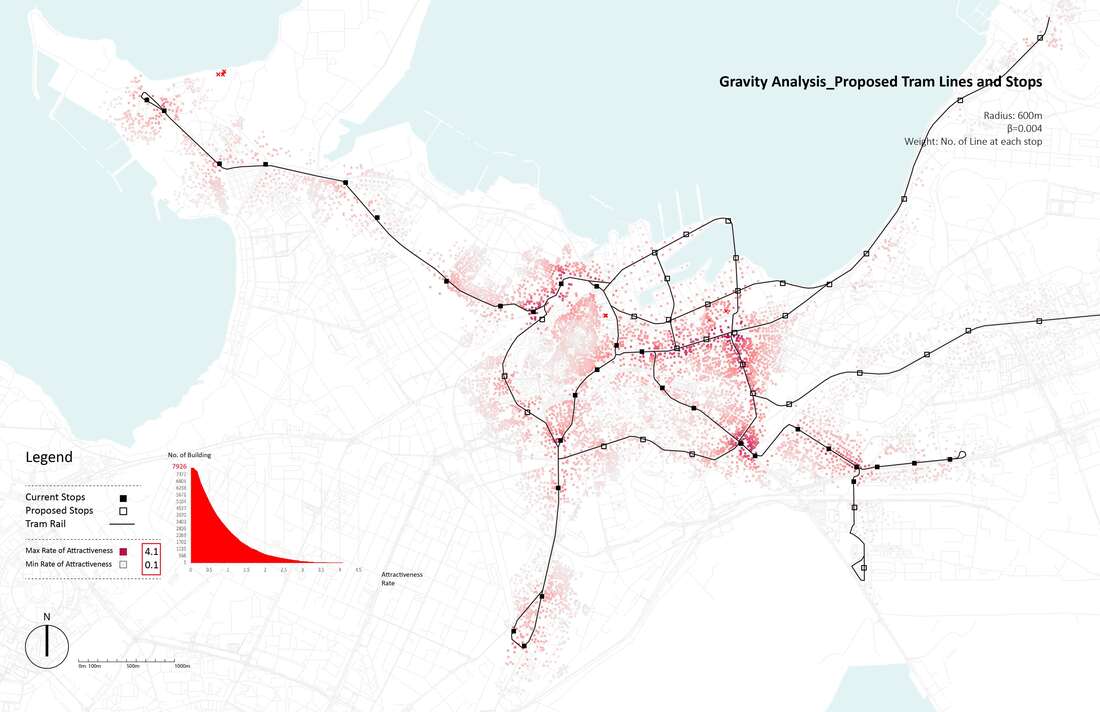
Research Goal: Public transit (Tram) network design and accessibility evaluation
Site: Tallinn, Capital of Estonia
Method: Accessibility analysis for multi-modal mobility (Gravity)
Tool: Urban Network Analysis (UNA) toolbox in Rhino
Date: 2016, GSD Advanced Seminar in city Form
Site: Tallinn, Capital of Estonia
Method: Accessibility analysis for multi-modal mobility (Gravity)
Tool: Urban Network Analysis (UNA) toolbox in Rhino
Date: 2016, GSD Advanced Seminar in city Form
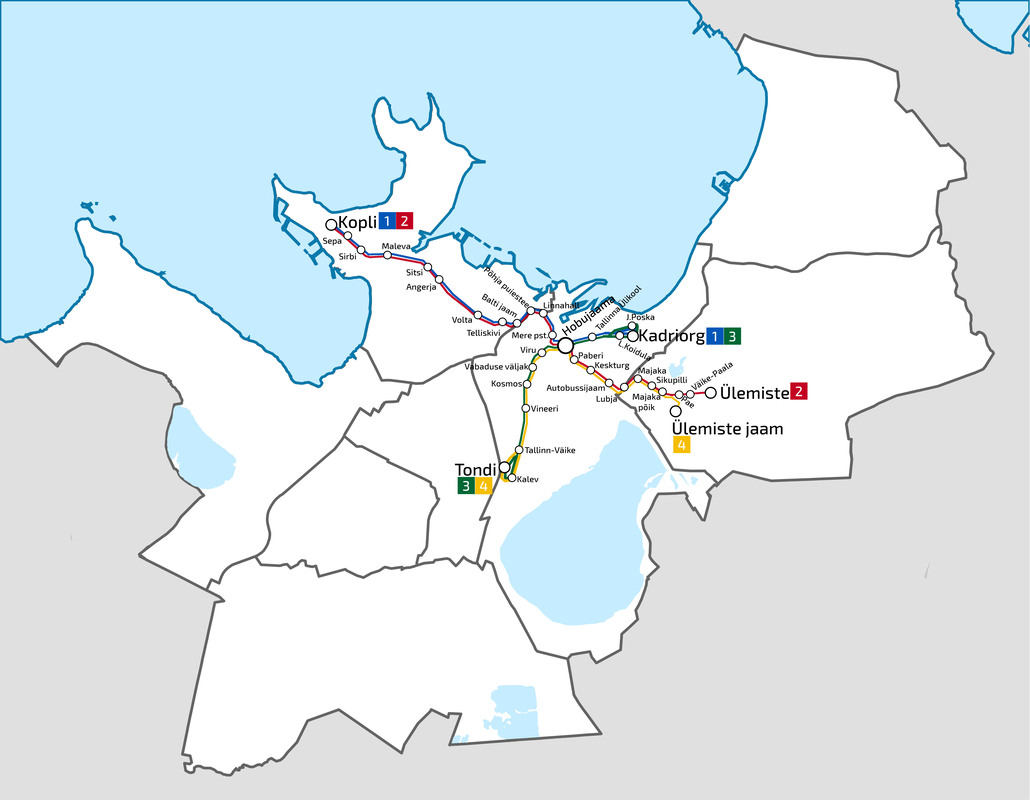
Map of the Tallinn Tram network
|
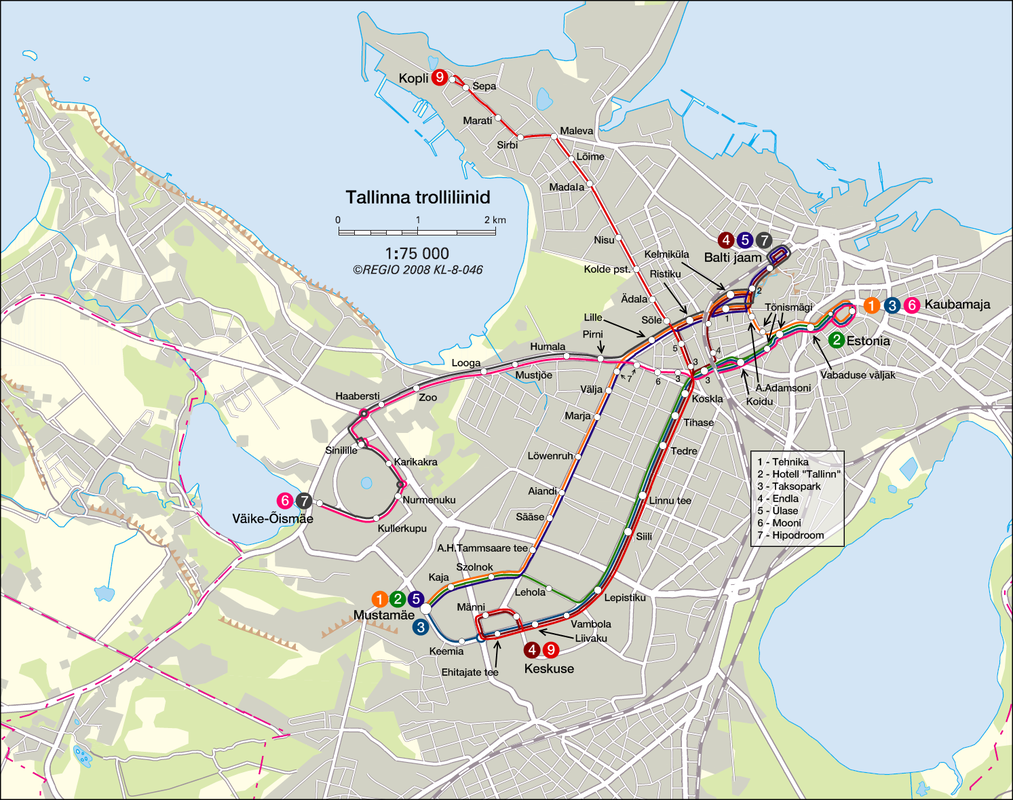
Trolleybus routes
|
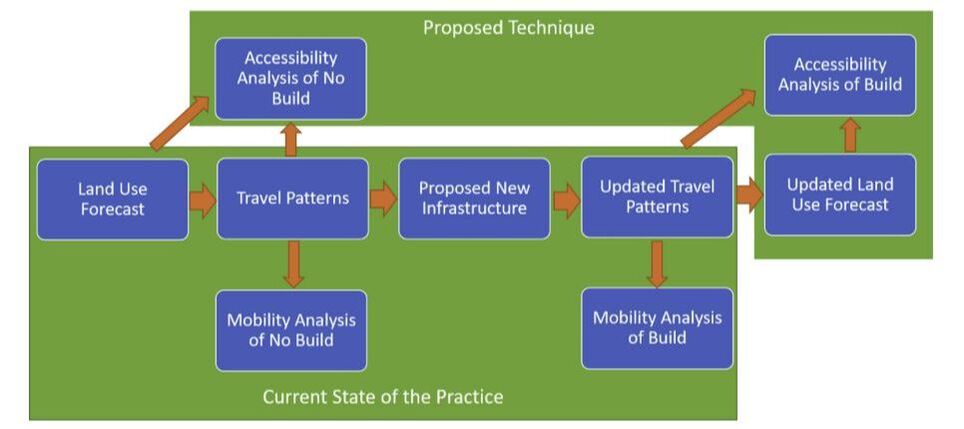
Accessibility-based transportation Project evaluation (L.A. Merlin et al, 2018)
|
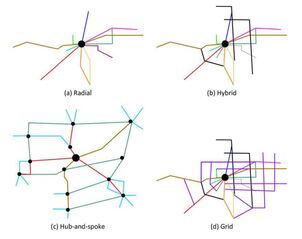
Fixed-route Networks (TCRP 3rd, p2-41, 2013)
|
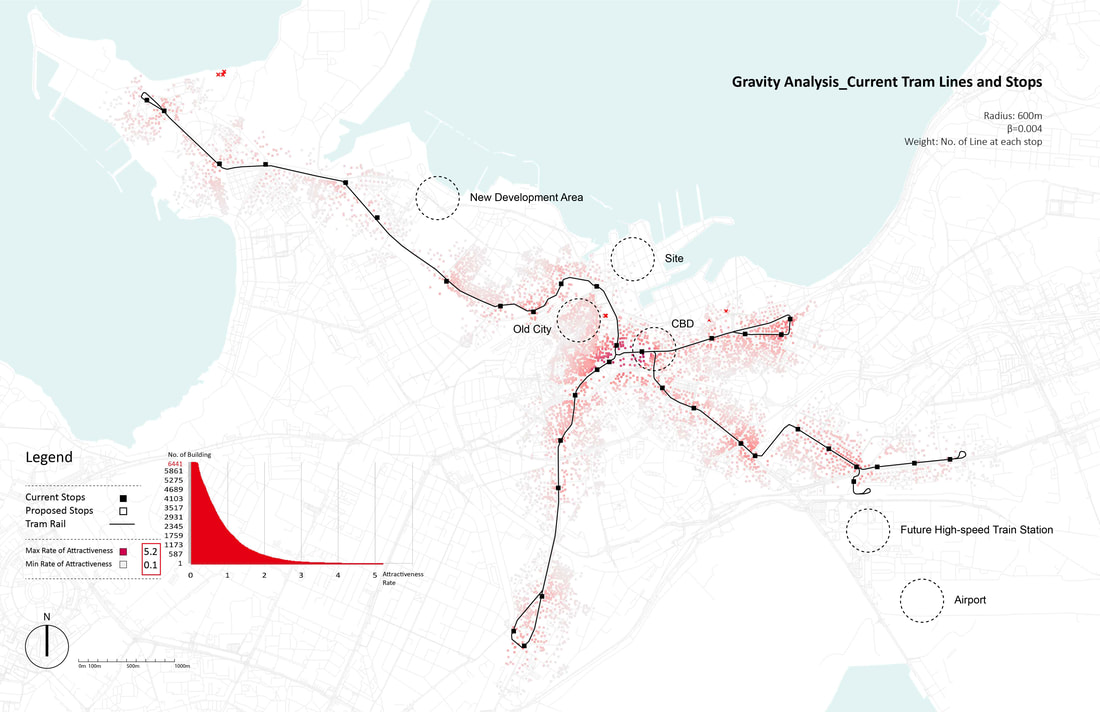
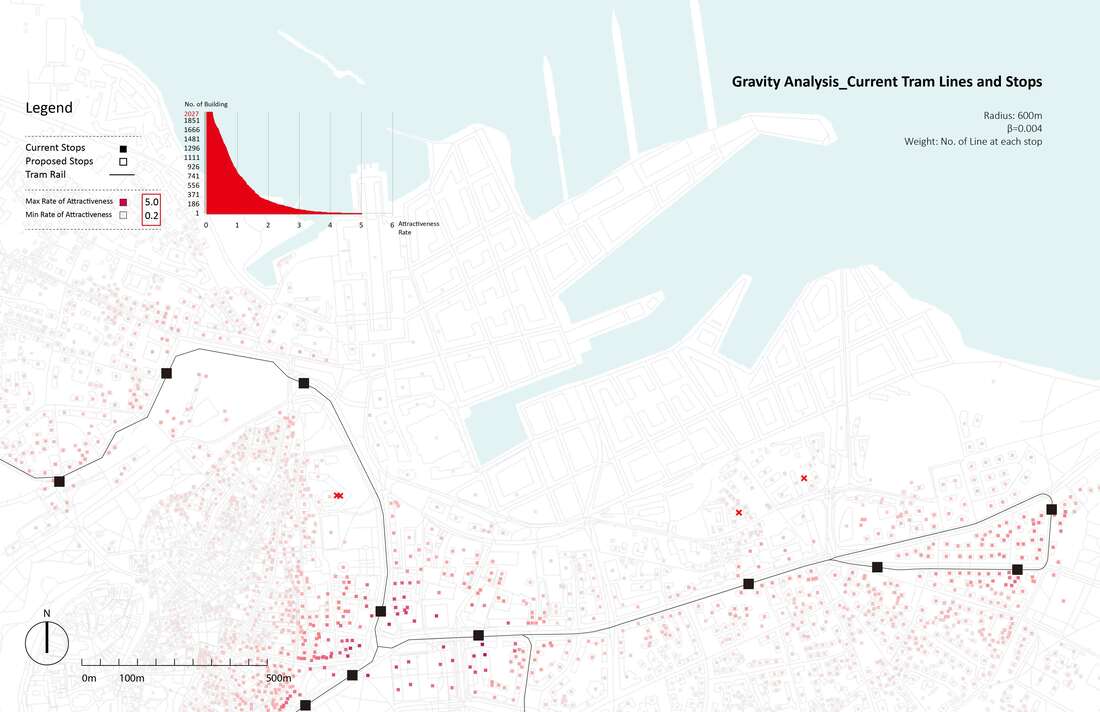
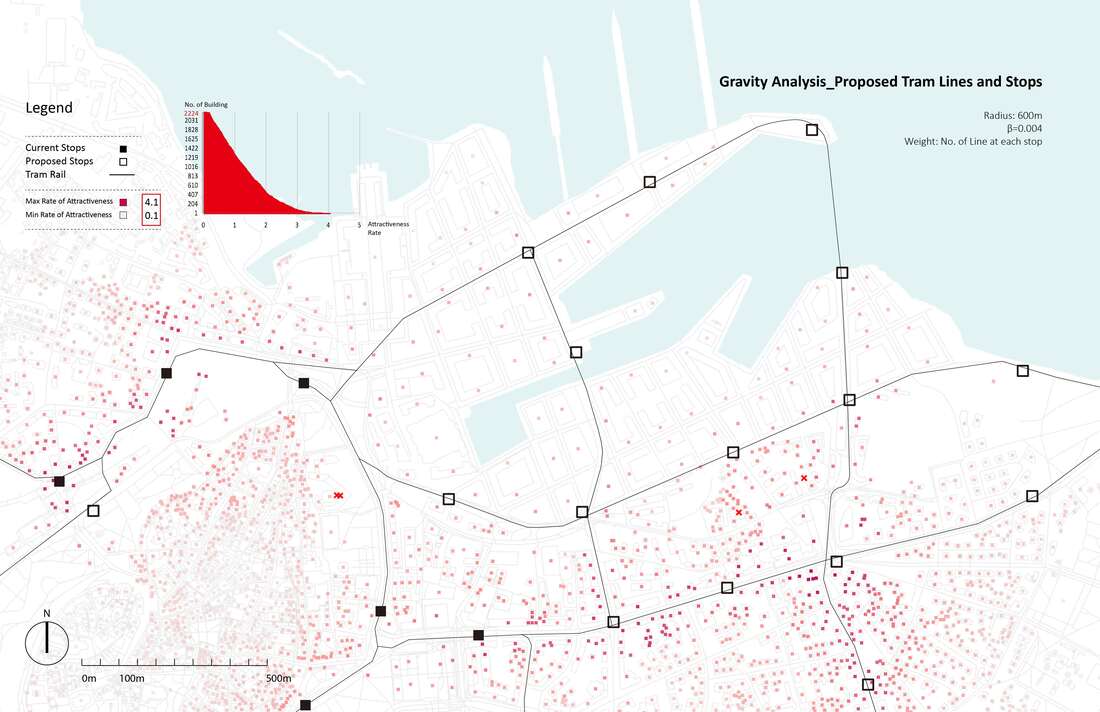
Tallinn City Level Tram Accessibility (existing) - Currently, the port and CBD have less connected with other core areas of the city such as airport by tram.

1. Revitalize the old canal track along the canal and all
the tram lines are complete.
|
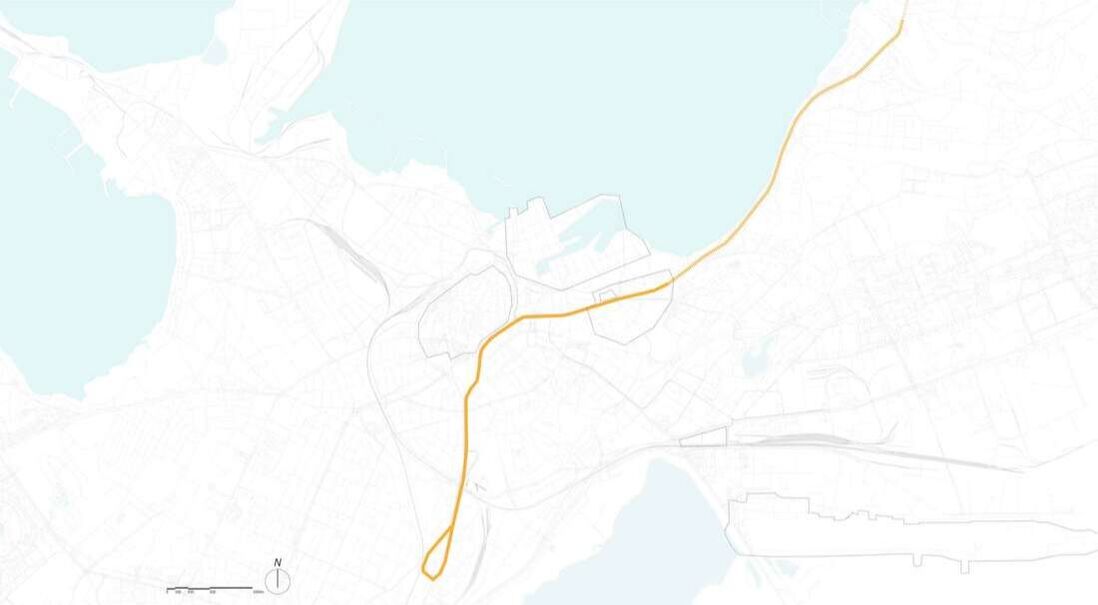
2. Tram lines detour around the port and the new CBD
area with an extension to Northwest area.
|
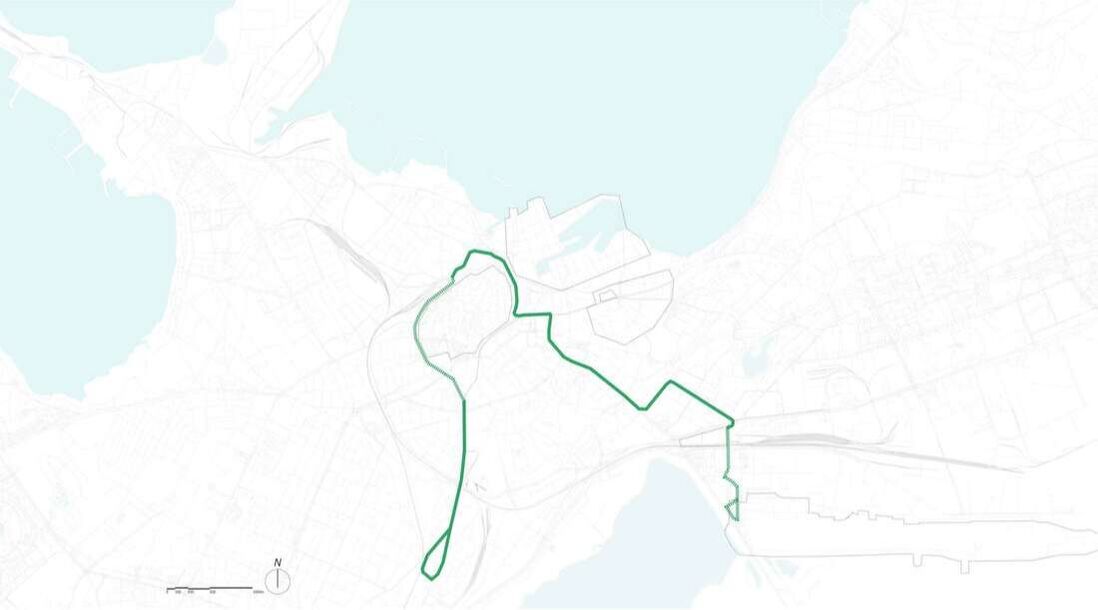
3. Tram lines extend to Northeast areas and connect to
the Airport terminal and detours around the historic
town.
|
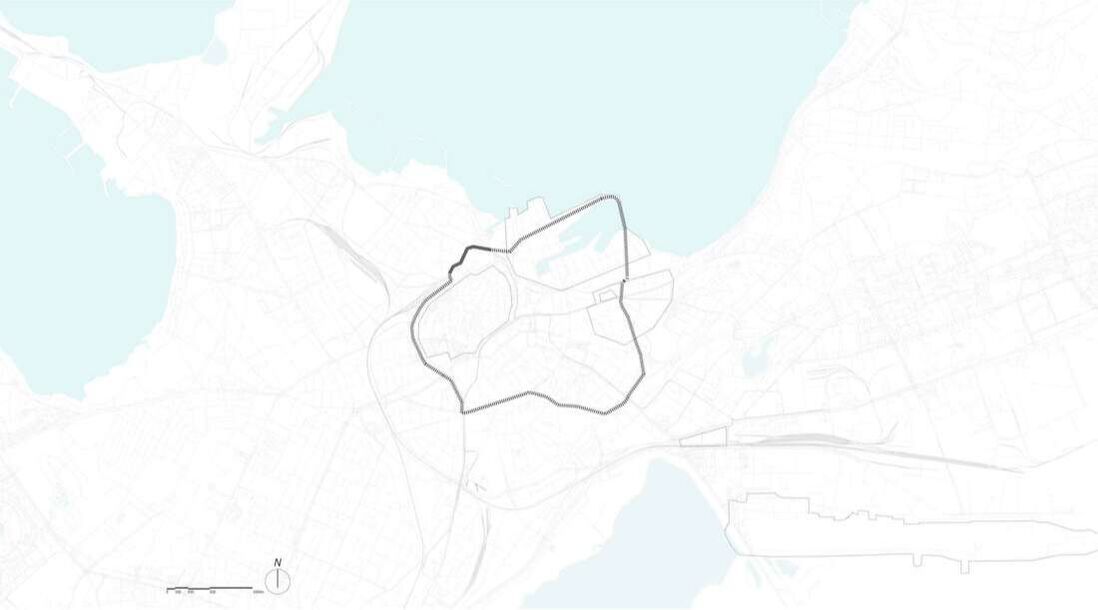
4. The City Circle line develops in the city and creates a loop and hybrid tram network system.
|
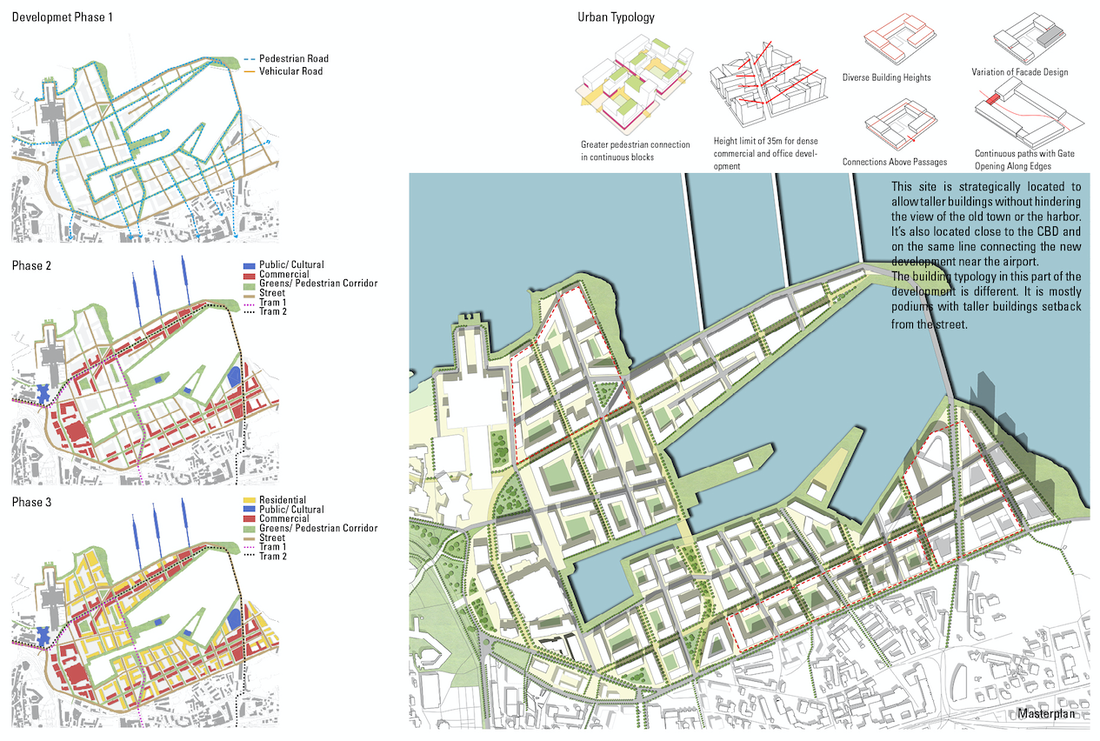
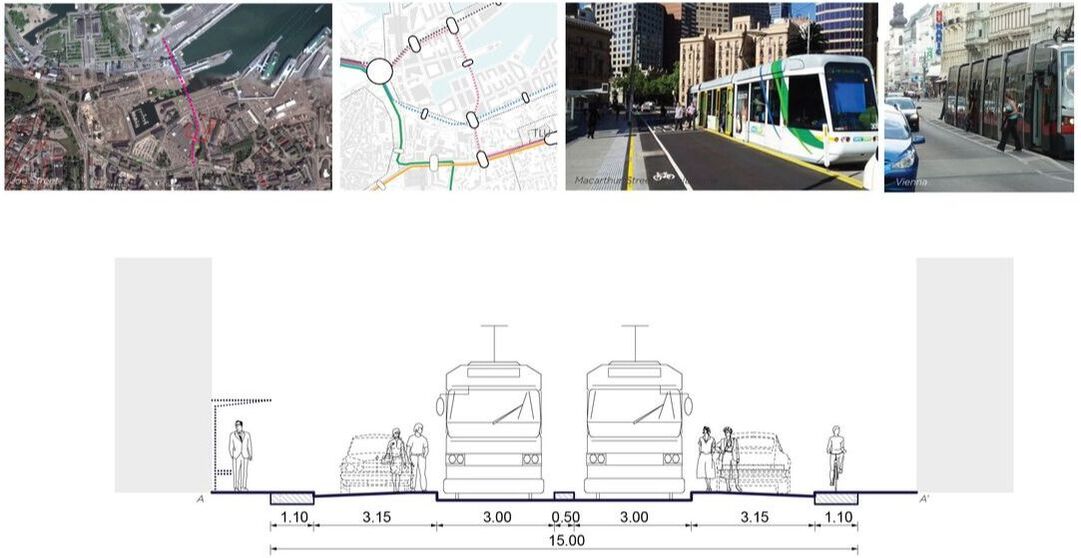
15M Road Station Design (proposal)
|
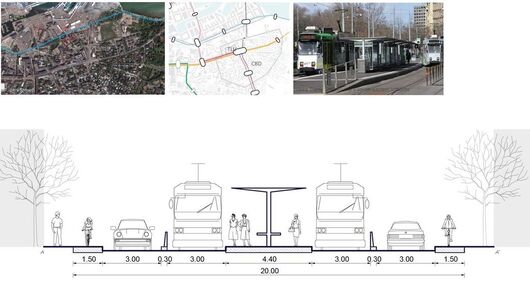
20M Road Station Design (proposal)
|
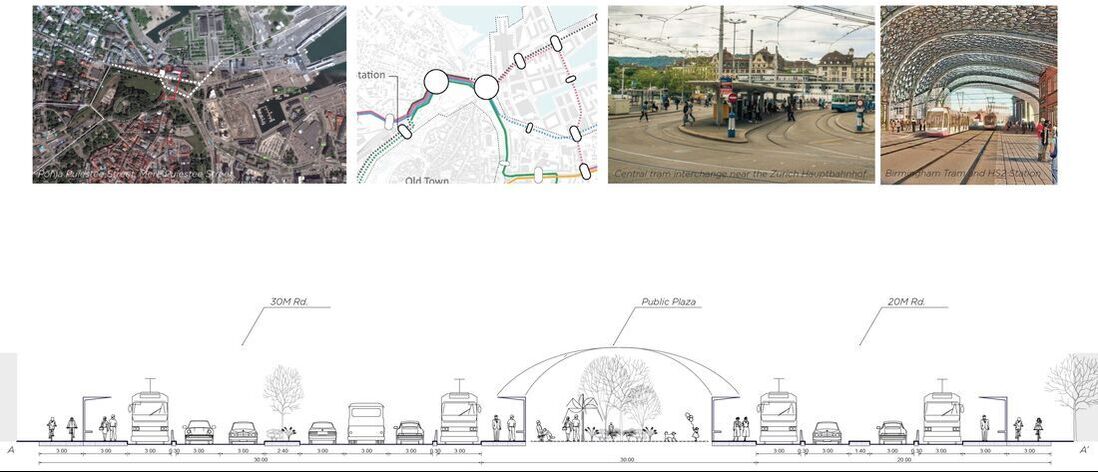
30M Road Station Design (proposal)
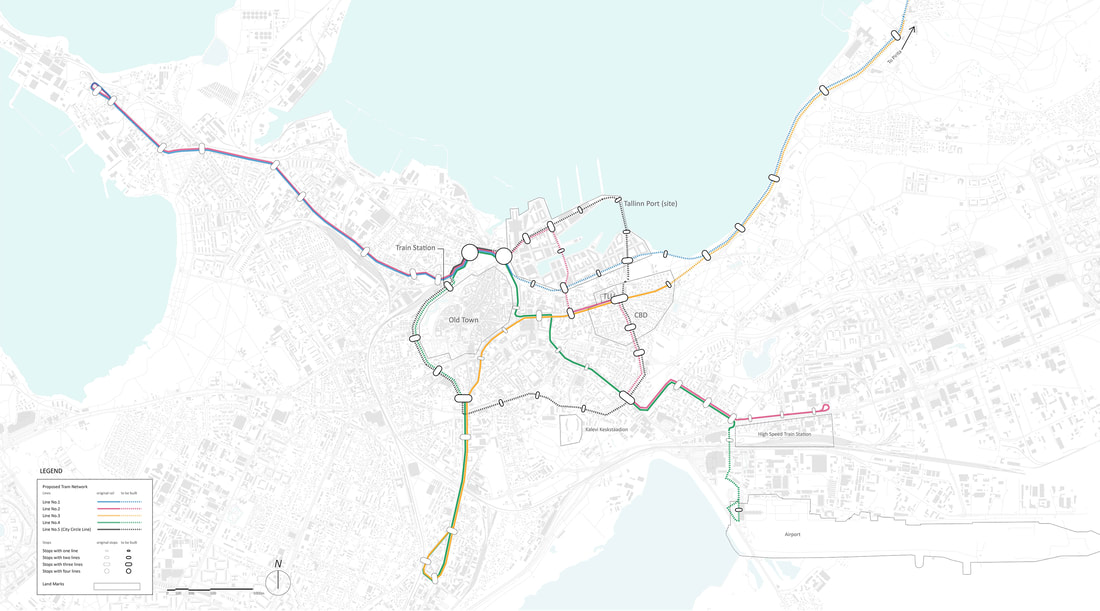
Final tram mobility route planning in Tallinn
The project introduces three new tram lines by four phases, as you can see from the map above. A loop line starting from the old city pass through the port site and connects the CBD and extends to southeast of the city, which is close to the future high-speed train station and airport. A branch line connects the old city and a desirable area to be developed in the future in the northwest of the city. And another loop starts from the train station, joins the south part of the line, and returns to the old city. Gravity analysis after proposed new tram lines and stations, the Tallinn port area is better connected with other spots of the city with increased tram accessibility. The gravity analysis also proves more equal accessibility of tram stops - although the maximum rate of attractiveness is decreased in the proposal, proportion of building with attractiveness between 0.5 and 3 increased.
References.
www.trb.org/Main/Blurbs/169437.aspx
merlin-accessibilityanalysistransportationprojects.pdf
onlinepubs.trb.org/Onlinepubs/hrr/1965/88/88-001.pdf
www.trb.org/Main/Blurbs/169437.aspx
merlin-accessibilityanalysistransportationprojects.pdf
onlinepubs.trb.org/Onlinepubs/hrr/1965/88/88-001.pdf
City size distribution
Project Type: Provision Analysis for Spatial Arrangement and Population Trends
Research Site: Boston Metropolitan Region (Boston-Worcester-Providence CSA)
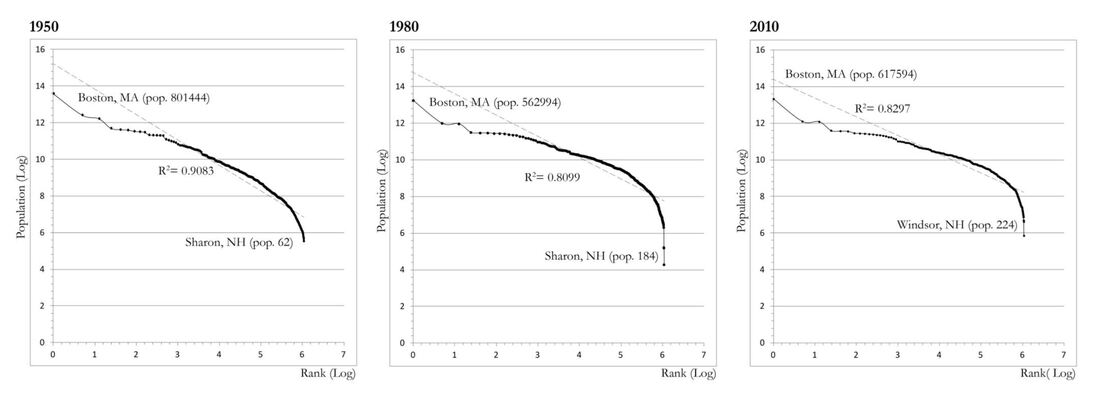
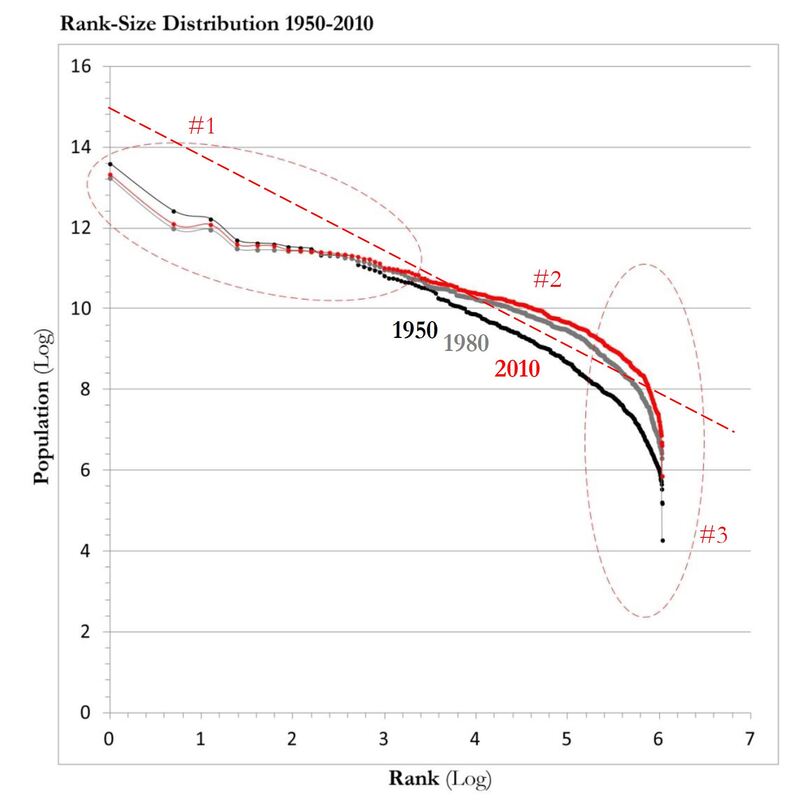
Method: Rank-size distribution of city population, Zipf's Law
Tool: Arc GIS, Excel
Date: 2017, GSD Towns and Settlements in Metropolitan Regions
Research Site: Boston Metropolitan Region (Boston-Worcester-Providence CSA)
Method: Rank-size distribution of city population, Zipf's Law
Tool: Arc GIS, Excel
Date: 2017, GSD Towns and Settlements in Metropolitan Regions
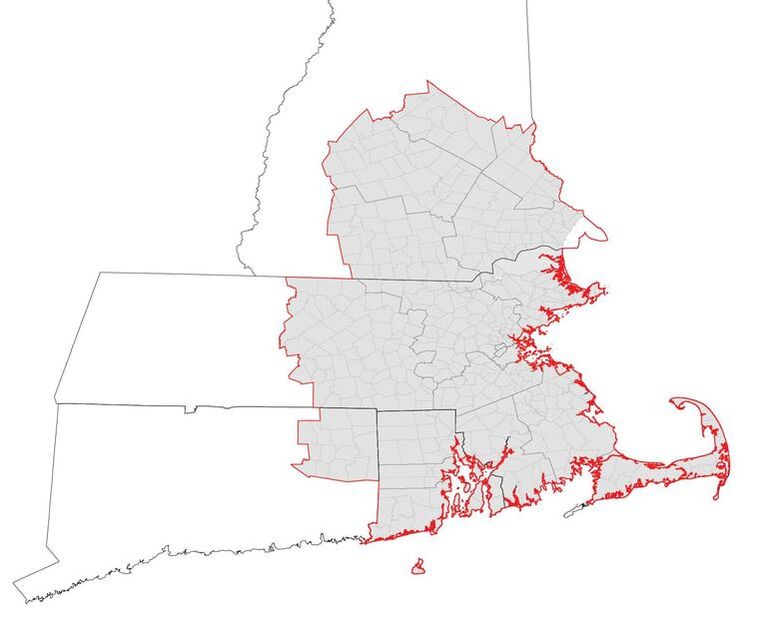
Combined Statistical Area (CSA)
|
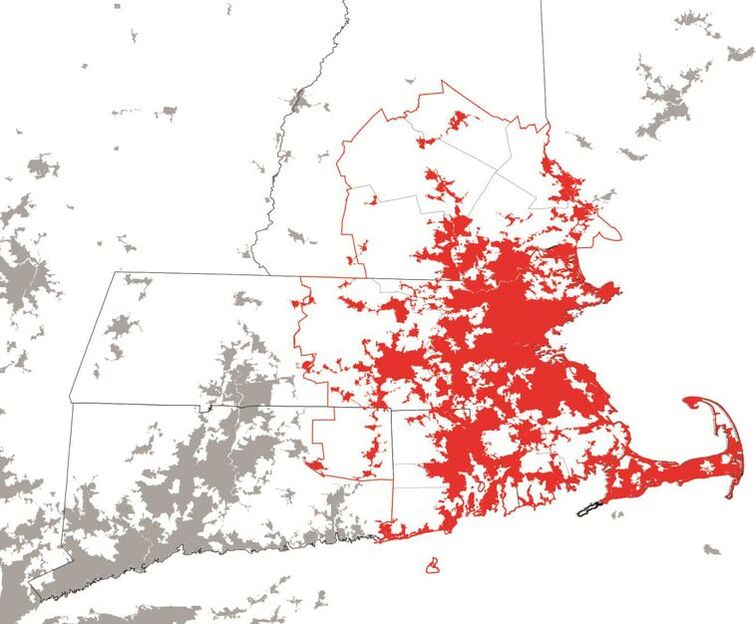
Urban Area Geography
|
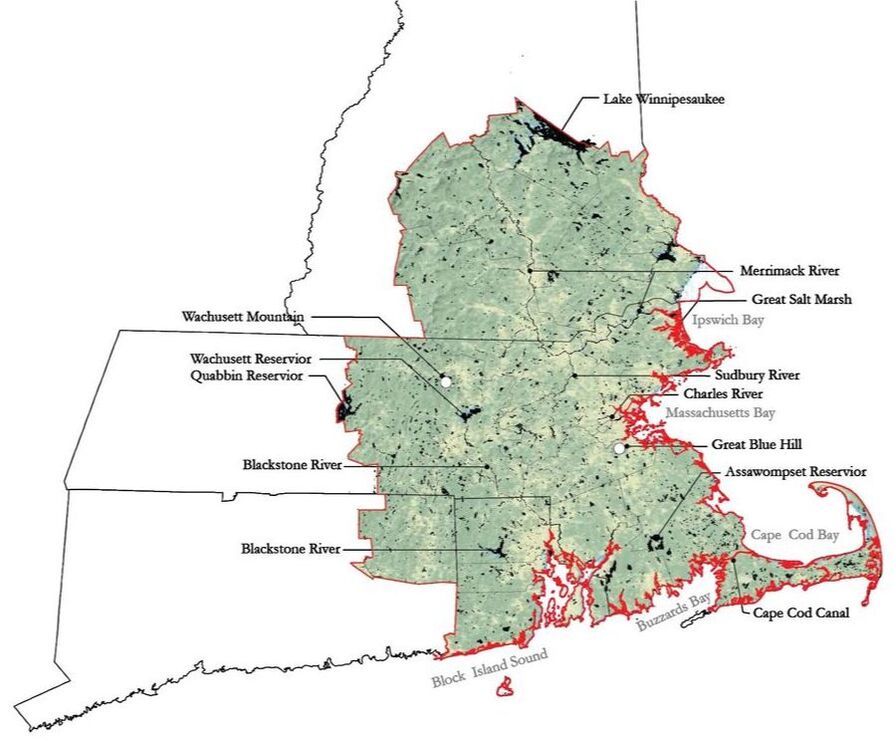
Physical Geography
|
CSA has 4 States, 19 Counties, 385 Towns, and population of 8,152,573 (#6 in U.S.). Boston's urban area is aligned coastal line.
Source. www.citypopulation.de/en/usa/combmetro/148__boston_worcester_prov/
Source. www.citypopulation.de/en/usa/combmetro/148__boston_worcester_prov/
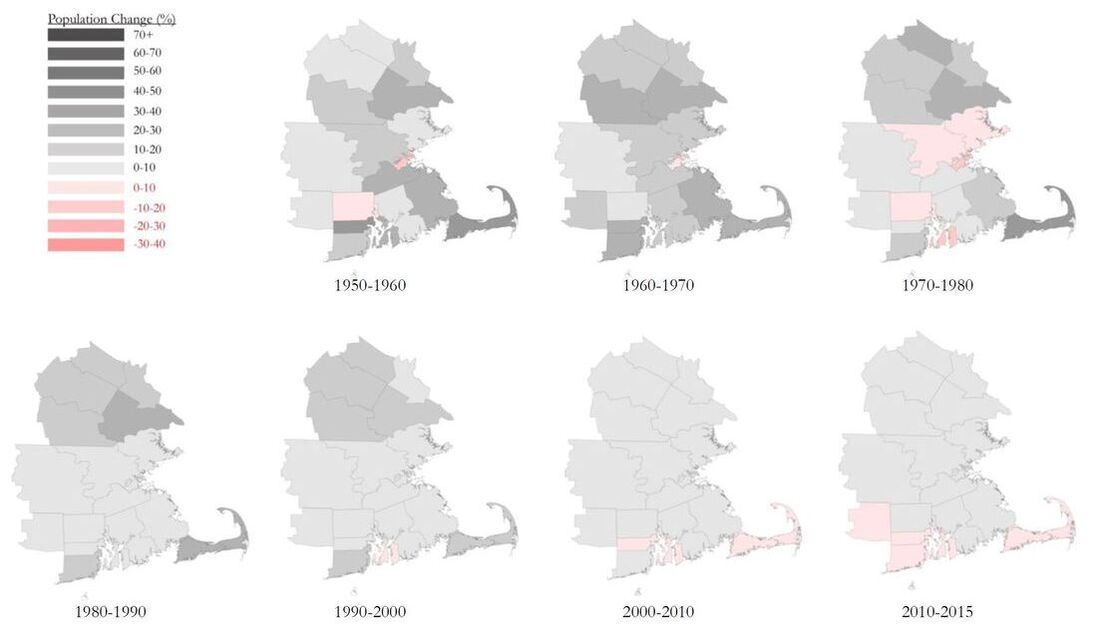
Population Change 1950-2015, by County
|
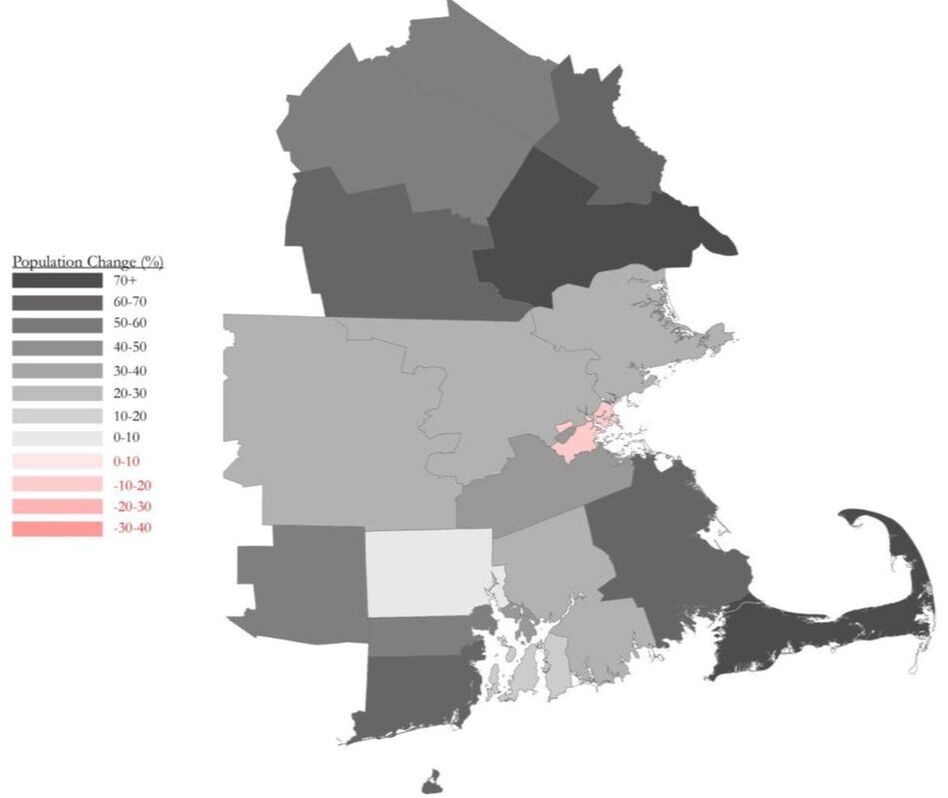
1950-2015
|
#1 The 'larger cities' - the 'principal cities' - in the CSA are concentrated below the population trend-line and are smaller than predicted by Zipf’s Law, including Boston. This arrangement indicates that these cities may be tenuously integrated with regards to Boston’s centrality, and may operate somewhat independently.
#2 The towns in the middle – the ‘suburbs’ – fall above the population line and indicate a relative degree of independence in the system . #3 The small towns –the 'rural areas' – exhibit a ‘diving distribution’, suggesting a dis-economy of scale in operation. |
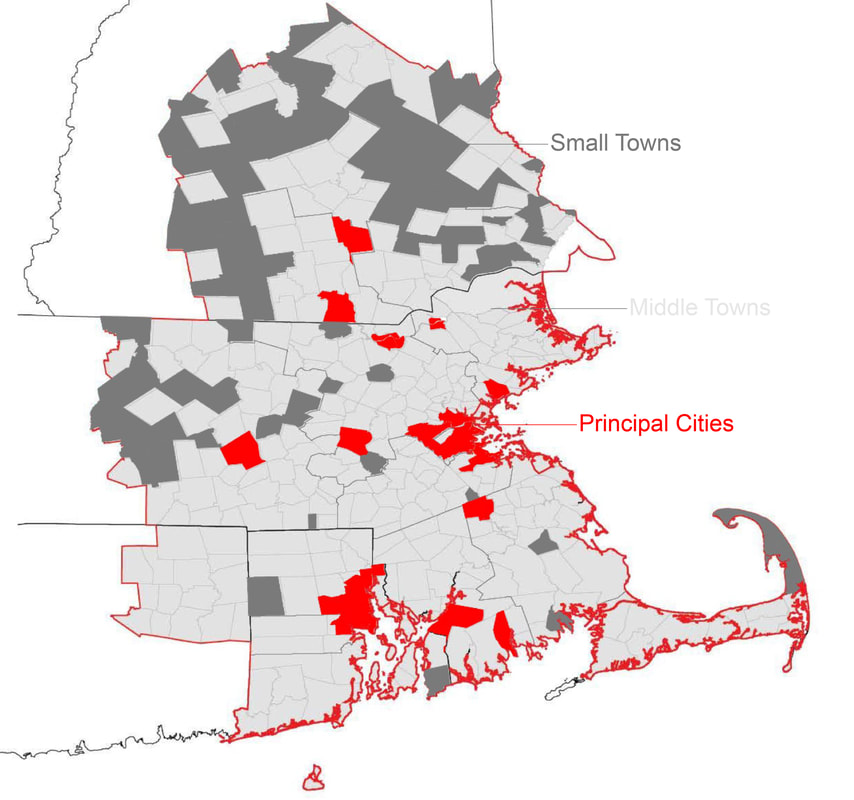
Population Change 1950-2015 by City and Town
|
|
Principal Cities: Population(>80,000) – most of the Principal Cities in the CSA were formed long before. Disperse located, not centralized near Boston (the state capital), geographically closed to Boston and well-connected with various transportation options
Middle Towns: This trend has grown since the 1950s and reflects the development of the suburban landscape generally during the period. Small Towns: population(min. = 5,000) – most of them are geographically remote and lack of transportation and connections to principal cities, some small towns, however, are more proximate to Boston, and relatively good access to both road and rail transportation options. |
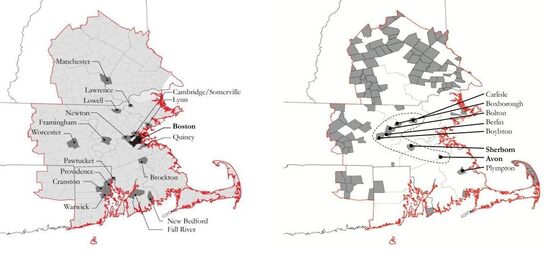
Principal Cities vs. Small Towns (Population)
|
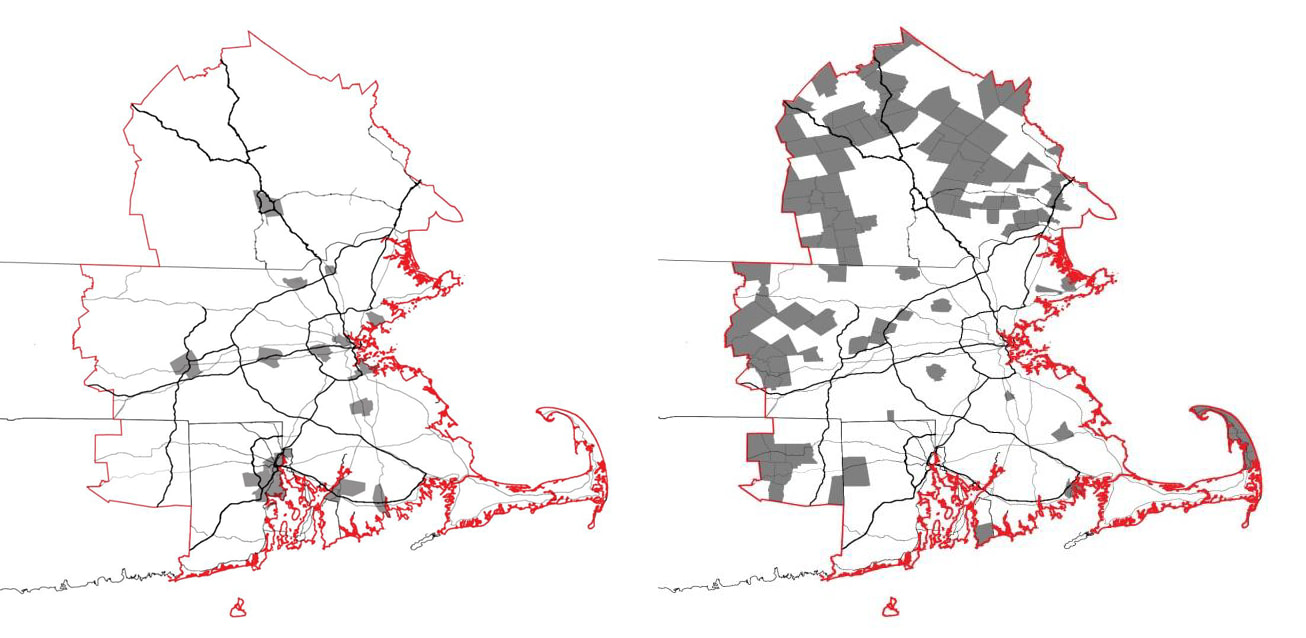
Principal Cities vs. Small Towns (Interstate Highway Road)
|
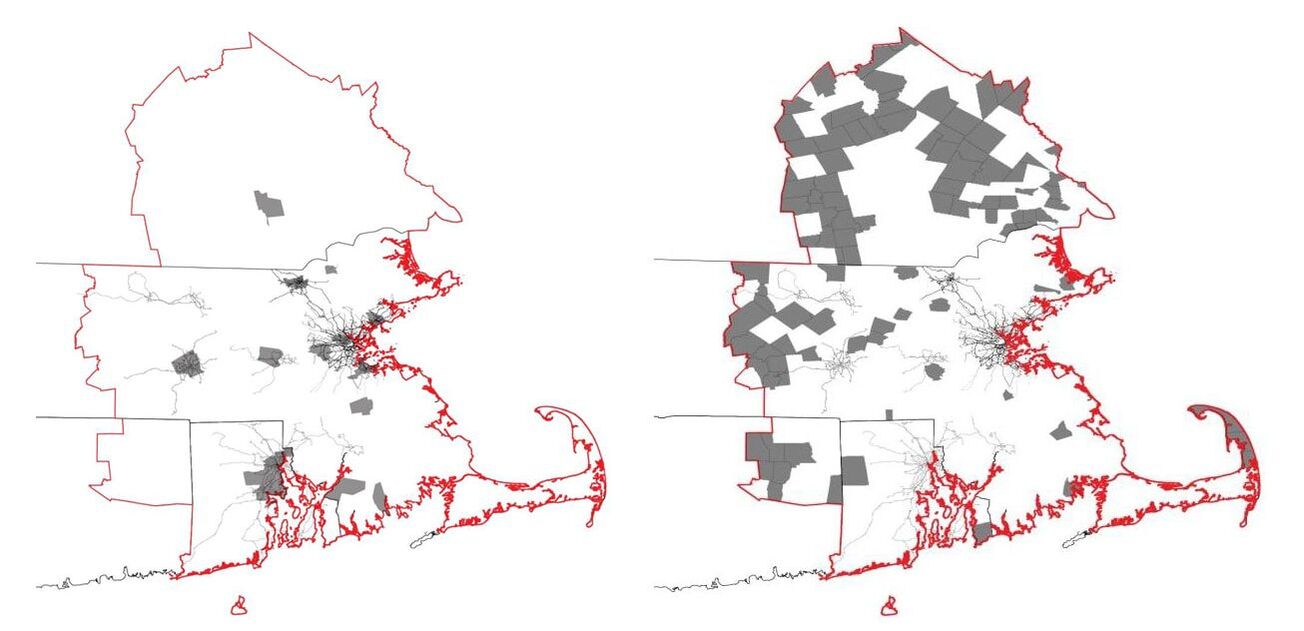
Principal Cities vs. Small Towns (Bus network)
Principal Cities vs. Small Towns (Urban Fabric)
|
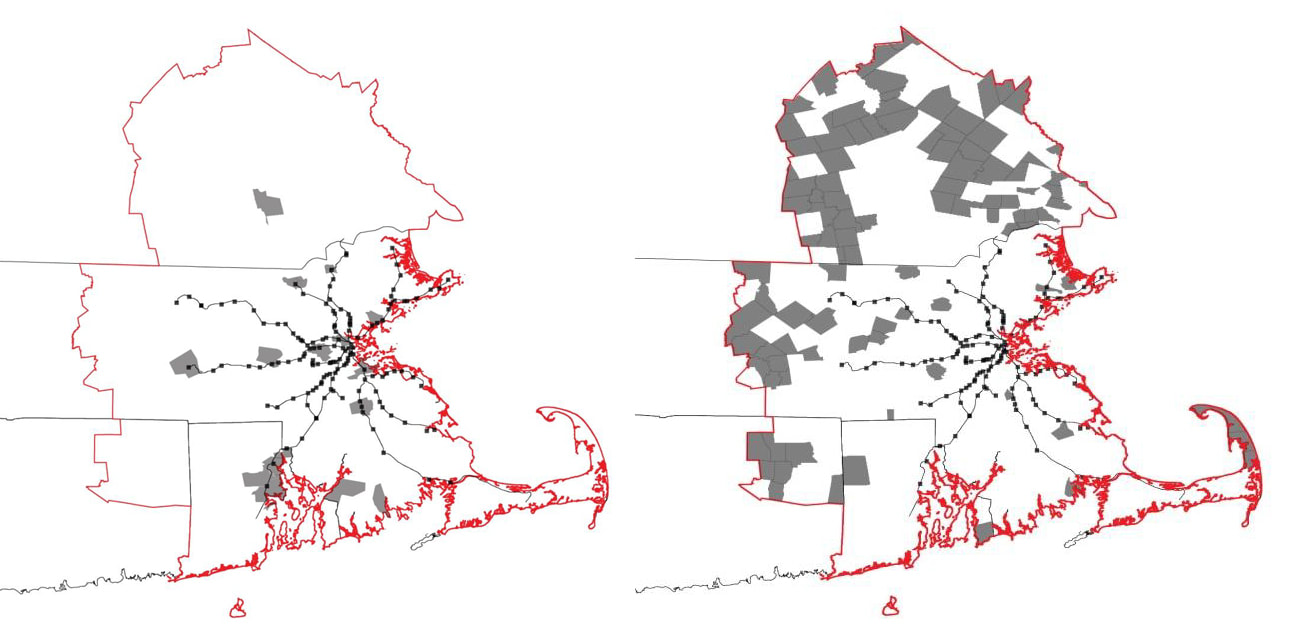
Principal Cities vs. Small Towns (Commuter Rail)
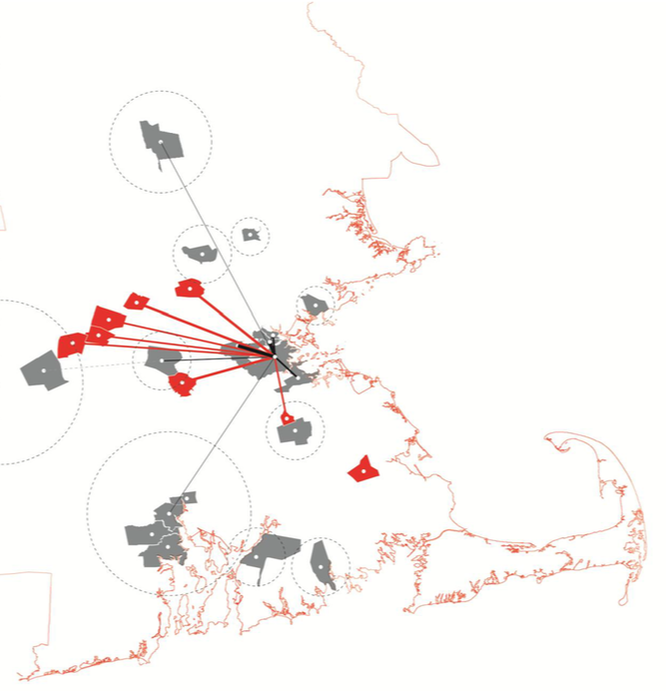
System Interdependence
|
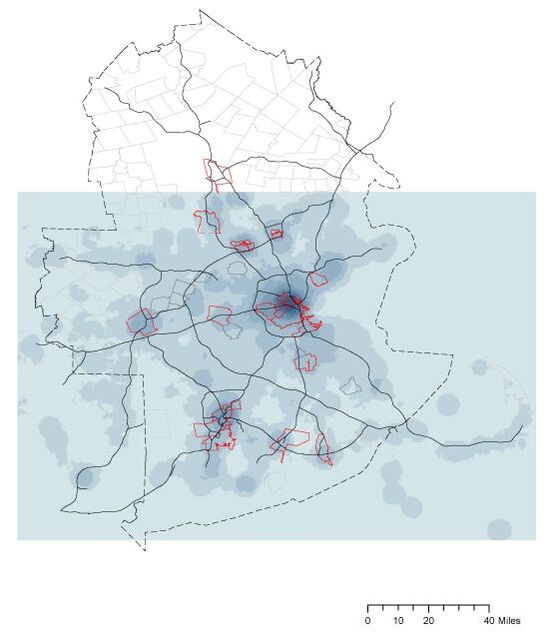
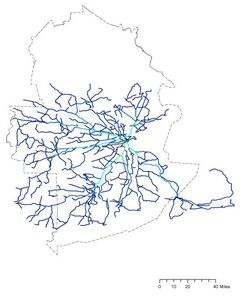
Findings: Even though physical infrastructures link principal cities in a way that suggests the hierarchy of the system, smaller towns are more functionally interconnected with Boston as measured by certain socioeconomic data. This points to the continued search by principal cities – particularly the legacy industrial cities like Lawrence, Lowell, and Worcester- to find relevance in the metropolitan region and underscores the growth in power of smaller suburban towns in the ‘post-industrial’ regional economy. More generally, the CSA is characterized by a lack of spatial and socioeconomic integration and operates somewhat independently (and increasingly competitive) with respect to large vs. small cities and towns.
Hydro-City, Istanbul
Projective networks of post mining area